
5 Call-Outs In Central Virginia's 2016 Suspension Data
In October, the Legal Aid Justice Center in Charlottesville released Suspended Progress 2017, their report on the 2016 school suspension data in the state of Virginia. This update to their report on the 2015 suspension data saw a continuation of trends from the year before. Some of the largest takeaways included the fact that Virginia schools continue to overuse suspensions as a disciplinary measure, and that they are often being applied disproportionately. Here are the breakdown in numbers for our area, as well as the overall trends and how they play out in our region.
Central Virginia Suspension Rates
#1: African-American students in Virginia are inequitably vulnerable to suspension, more than any other racial group.
African-American students are a minority of the student population, but receive a majority of the suspensions in the state. The report states that "African-American students made up 23% of the statewide student population, but received 59% of short-term suspensions, 57% of long-term suspensions, 43% of expulsions, and 34% of modified expulsions. The suspension rate for African-American students was 3.8 times larger than the suspension rate for Hispanic and white students."
The broader trend is true for our region too: every school in our area is more likely to suspend a black student than a white one. This year, Lynchburg City and Nelson County fall into the top 25% highest suspension rates for African-American students in the state. Here's how it breaks down per locality:
Local Racial Disparity in Percent of Students Suspended
#2: Students with disabilities are also high-risk for suspension.
Local Suspension Rates Based On Disability
While multiple of our localities have a significant disparity in suspension of disabled versus non-disabled students, Nelson County's rate of suspending disabled students is the highest, falling into the highest 25% within the state.
The report also notes that disparities in suspension come into sharp relief when looking at the overlap of race, gender and disability. Nearly one quarter of African-American males with a disability were suspended at least once. They were 20 times more likely than white female students without disabilities to be suspended.
#3: Very young students (3rd grade and below) also receive large numbers of suspensions.
This is a problem because we know that young children don't come built in with all the pro-social behavior they need. While we want to ensure that classrooms are safe places for all students, we also don't want to criminalize non-ideal, but developmentally normal, behavior. We need to make sure we're teaching needed skills, not just penalizing students for not having them.
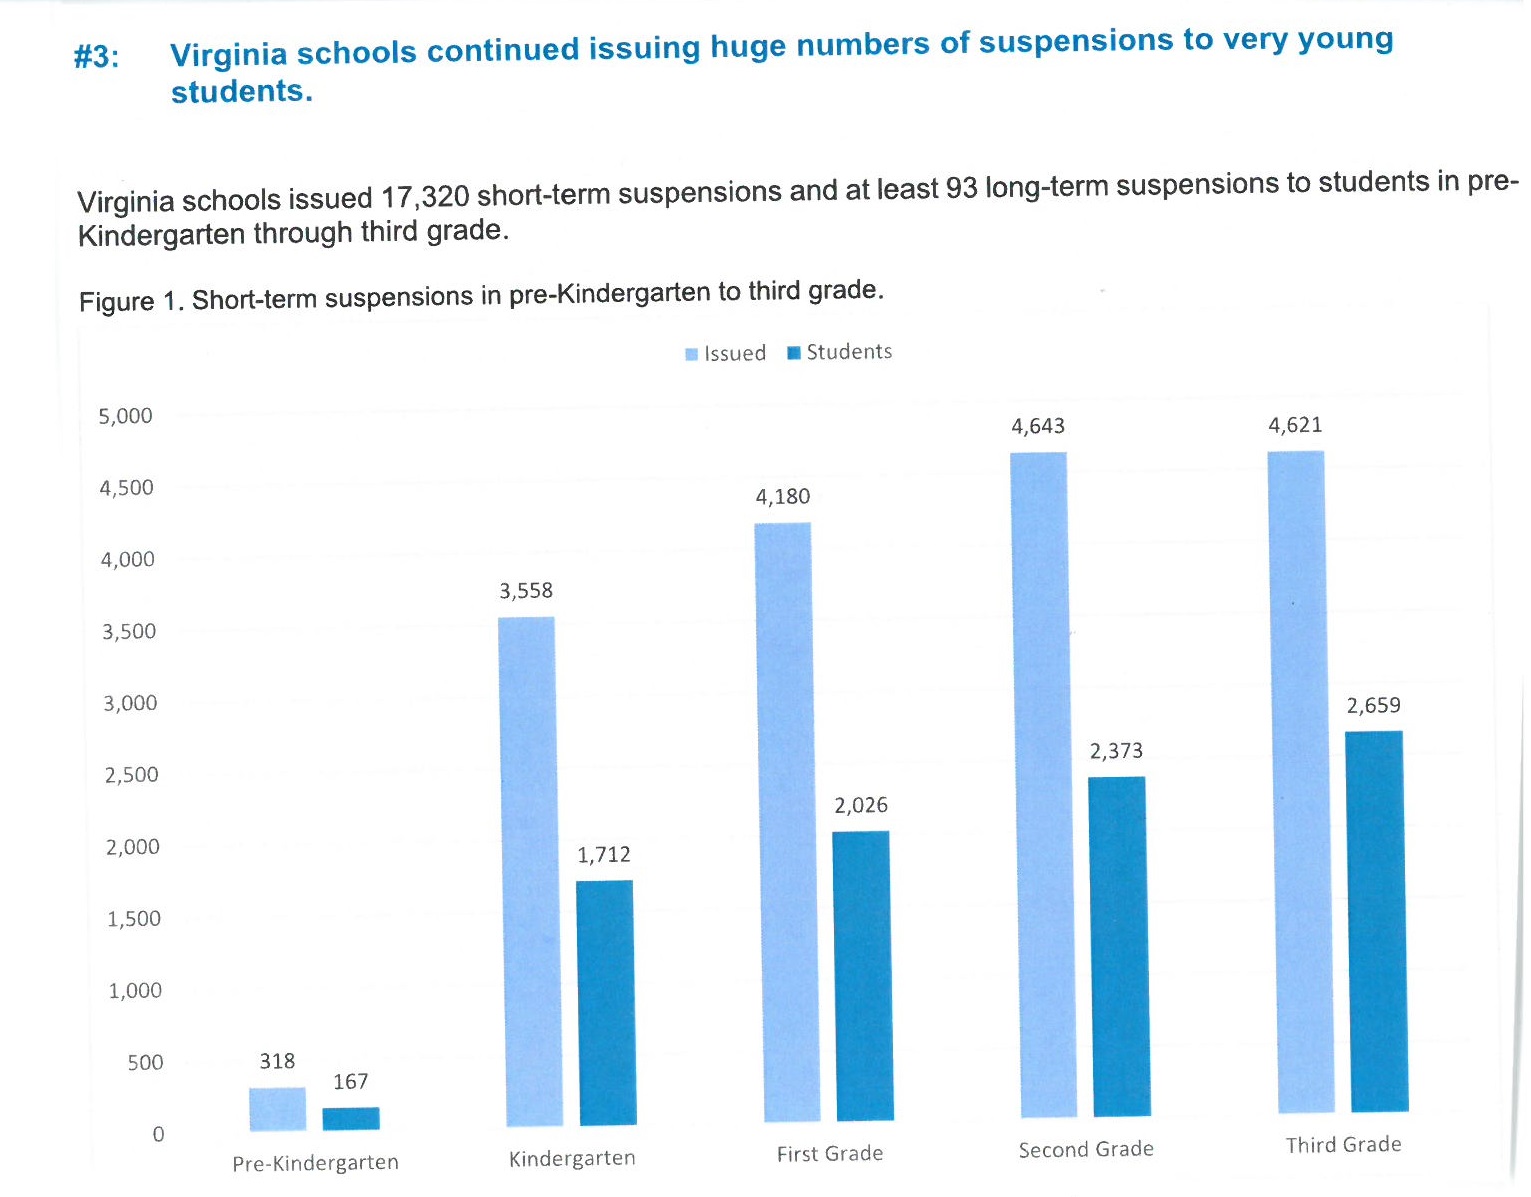
Image from Legal Aid Justice Center's Suspended Progress 2017 report.
#4: Too many suspensions are issued for vague, subjective, or minor offenses.
Because of the perspective-based nature of many of the below infractions, suspension rates are significantly impacted by who is standing in the front of the classroom. African-American students are markedly less likely to receive exclusionary discipline when taught by black educators, and this effect is enhanced even more for African-American boys taught by black males.
One other thing--can we talk about the irony that forced time away from school (suspension) is seen as an appropriate punishment for a child having voluntarily spent too much time away from school (truancy)?
#5 Virginia Schools continued to issue most suspensions for relatively minor, non-violent offenses.

Image from Legal Aid Justice Center's Suspended Progress 2017 report.